|
|
| |
|
| |
|
| |
|
| |
|
| |
|
| |
|
| |
|
| |
|
| |
|
| |
|
| |
|
| |
|
| |
|
| |
|
| |
|
| |
|
| |
|
| |
|
| |
|
| |
|
| |
|
| |
|
|
|
| |
|
|
The Financial Crisis and Translator's Mathby Fotini Vallianatou | |
|
Introduction
One of the few positive aspects of the financial crisis-related business slowdown is that plenty of time is available for calculations. When work is coming in, and the deadlines are pressing, there is no time for luxuries like statistics. Yet you are sure that money will come and the bills will be paid! Recently the work flow was not so pressing, so I found time to review my workload of the last few years. The Microsoft Access-based application, which I use to record my jobs (Translation Job Registry) was very helpful in providing the data for calculations (1, 2). The main questions I wanted to answer were: how many hours do I work daily on average, how much more can I do, and how did the financial crisis affect my work? Also, I wanted to see how much of the work that was coming in was classified as "discounted work" due to fuzzy and exact matches. The main reason I started this project was curiosity (and availability of spare time...). But as always, going back to the past was enlightening for the future! My findings were rather interesting and I thought it worth sharing them with you.
Work in hours In order to compare the workload, the work volume of all projects was converted into hours as follows:
Working hours per year A rough estimate of the "working time" in a yearly basis was made assuming that the day has 8 working hours, the week has 6 working days and that 30 days per year are left for vacation. This gives 2264 working hours a year. This value is arbitrarily called "maximum average working hours per year" in this work. This calculation correlates well with ATA's average gross income of full-time independent contractors (3). According to the 2007 Compensation Survey the gross income of a non-US based full-time independent contractor averages aprox. 57.000 USD. With a hypothetical rate of USD 0.1 per word, this analogs to 57.000 words per year; and this can be converted to 570.000/250 = 2.280 hours per year. Quite close to my arbitrary "maximum average working hours per year." It is also close to the 2218.5 hours that Lawrence Schofer estimates it's the average available work hours per year in his recent article in ATA Journal (4). Comparison to world financial data The Dow Jones industrial average was used as a rough estimate of the stock market during the period of my study (5). Percentage of discount work As discount work was considered the part of a project that was characterized as exact match or fuzzy match, and consequently it was paid in a discount rate. The percentage of discount work was calculated dividing the sum of exact and fuzzy matches to the total word count. This calculation was made using the yearly totals of projects registered with word counts. Minimums and hourly paid jobs were not included.
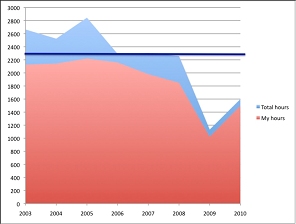
Results Workload My yearly workload as estimated with the calculations mentioned above is shown in Table 1 and in the right diagram of Figure 2. In the same diagram you can compare my annual hours of work to the "maximum average working hours per year."
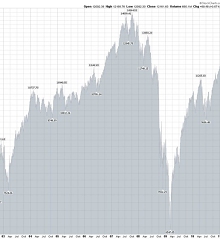
A comparison of my workload with the stock market values is shown in Figure 1. Notice the surge in both diagrams for 2009. .
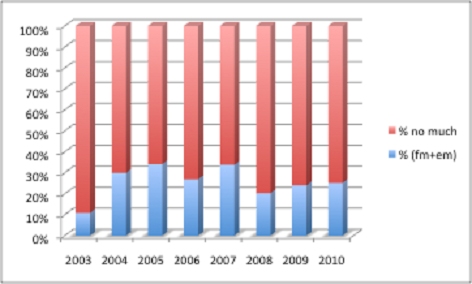
Discounted work The percentage of discounted work on a yearly basis is shown in Table 2 and in Figure 2.
The parallelism between my work load and the state of the economy as measured by the Dow-Jones average (see Figure 2) was more or less expected. The profession sensed the crisis and responded appropriately very quickly (price reductions, alliances etc). For me it was more obvious that the work load would diminish, since a considerable percentage of my translations is related to the automotive industry, which experienced a huge slowdown during the crisis. However, even in the worse period of the crisis, some work did come in. Even in 2009, the worst year, I received work which equaled the 50% of the average work load of the previous years. The secret here was translation topic diversity and a considerable pool of clients. Although automotive is the big portion of the pie in my case, other areas also exist in my portfolio and they kept the work alive during this hard time. Also, over the years, I was able to acquire a clientele numbering enough agencies; this also helped and reminded me that it is important to keep all clients well served and happy. You never know when you will need them, regardless of how big or small they are. The data concerning my productivity were very interesting. During the years of high work flow (2003-2008) I was receiving projects that required 2480 hours of work a year on average. This is well above the 2264 hours of my arbitrary "maximum average working hours per year." Even if you subtract the work that was handled by my coworkers, a yearly workload of 2078 hours on average remains, that fills approximately 92% of the "maximum average working hours per year." Please remember that in all these calculations no administrative work is included. Time needed for communication, filing and archiving, invoicing etc. must be added on top of the hours mentioned above. Schofer in his article estimates that these tasks can take up to 30% of your actual working time (4). This means that at that period I had probably reached the maximum of my capacity as a solo full-time freelance translator. The work of this period fully filled 6 days a week, 11 months a year (with daily work that in total exceeded considerably the 8 hours of hypothetical working day). The previous paragraph shows that the answer to the question "how much more can I do?" was straightforward for the period between 2003 to 2008: not much. And this by default sets my target for the current period. Having experienced the consequences of a shortage of workflow during 2009, I'm rather realistic with my expectations. It seems that the best I should expect is to return to the 2003-2008 workload. The results of 2010 were encouraging, but I'm still well behind the good years. Discounted work is always something that creates concerns. The prevalence of translation tools in the profession and the accumulation of large translation memories in the hands of agencies could mean that year-by-year the percentage of exact and fuzzy matches in the texts to be translated would gradually increase. My findings for the last 8 years do not support this fear. It seems that the percentage of fuzzy and exact matches is relatively stable, reaching approximately 25% of the words received for translation. And this reconfirms the findings of my previous work, indicating that the introduction of translation tools has improved productivity without jeopardizing income (2). And while I'm writing these last lines, another project came in! It seems that we are again on the uphill of the curve. My calculations indicate that I need to run in order to catch up with my personal high scores of the past. So I'm returning to the real work, hoping that this analysis of my use of time will be as useful to you as it was to me.
References
|
|
|
|


